
Over the past few years we’ve seen a number of the larger CGM manufacturers allowing us to infer that their newer products are better because they have more….
“More what?” I hear being asked around in the background?
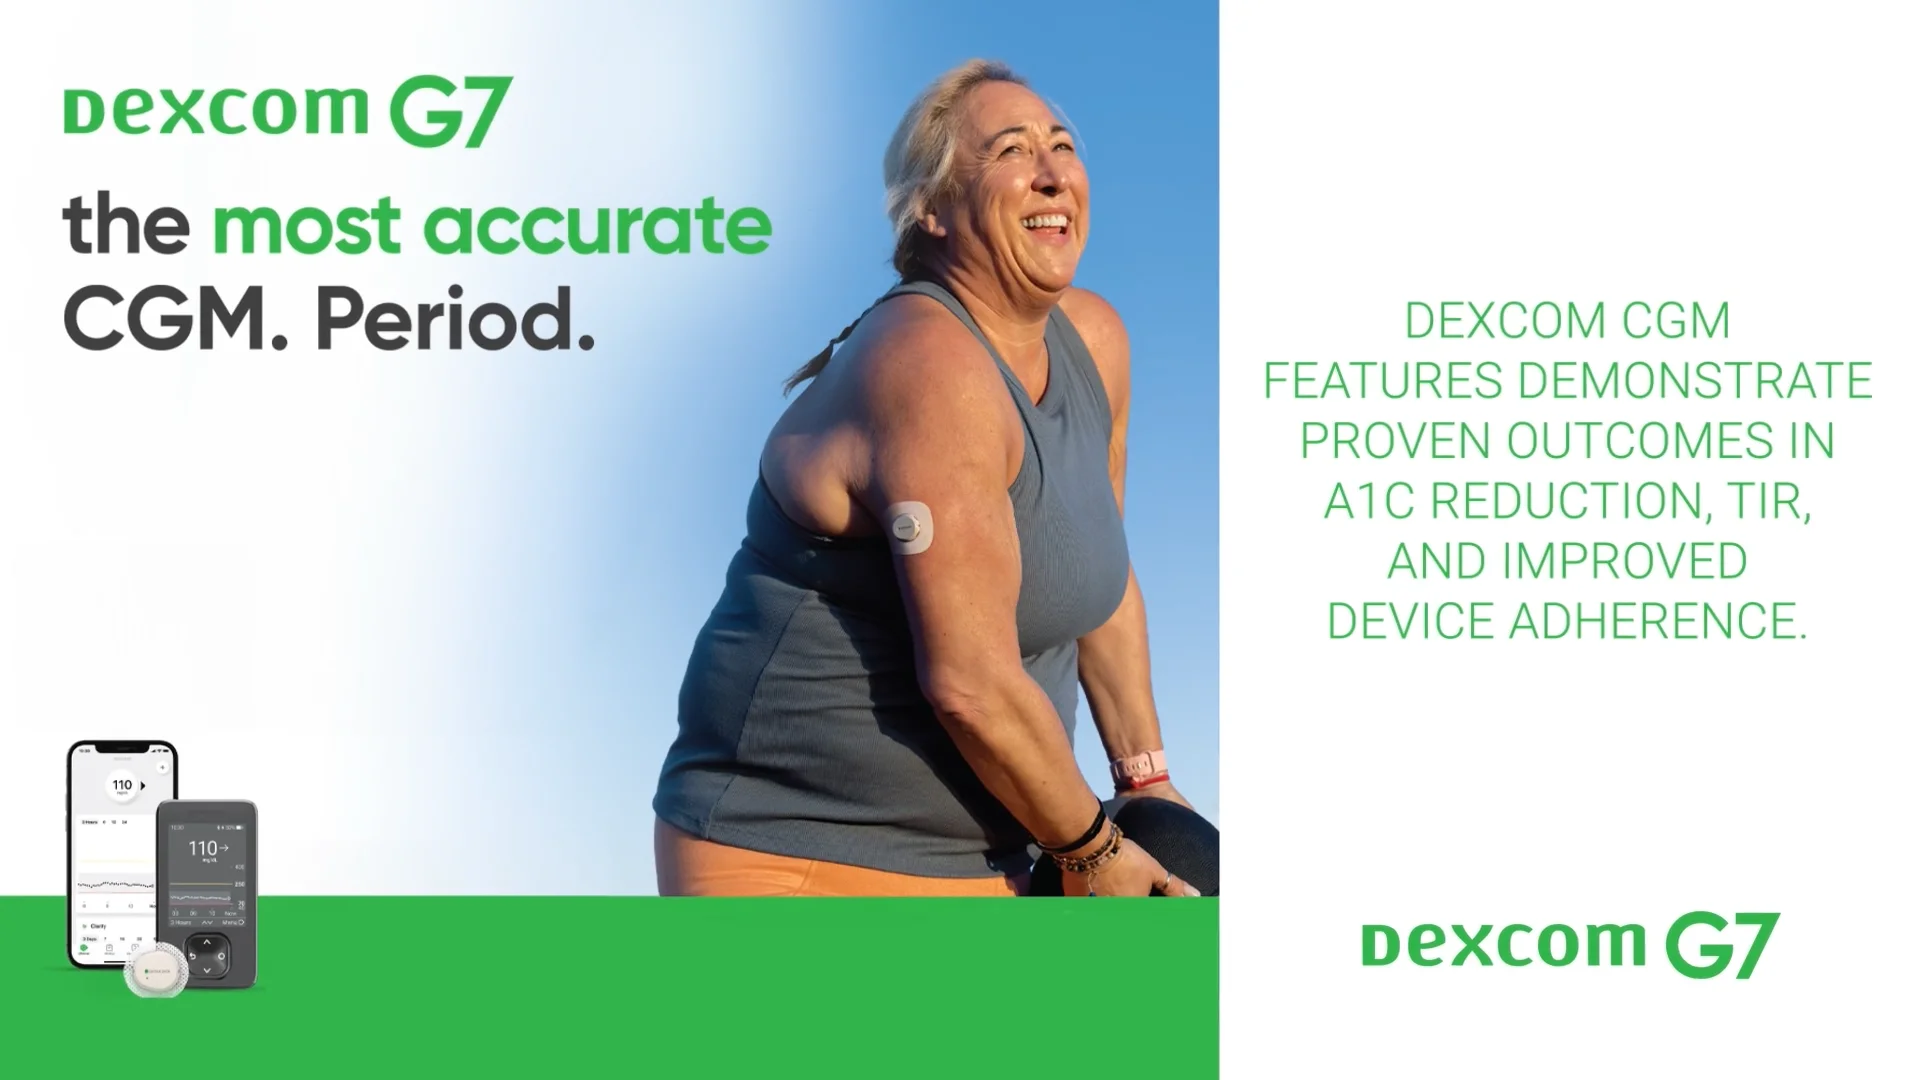
Dexcom are happy to tell us that it’s “More accuracy” and “More Power”.
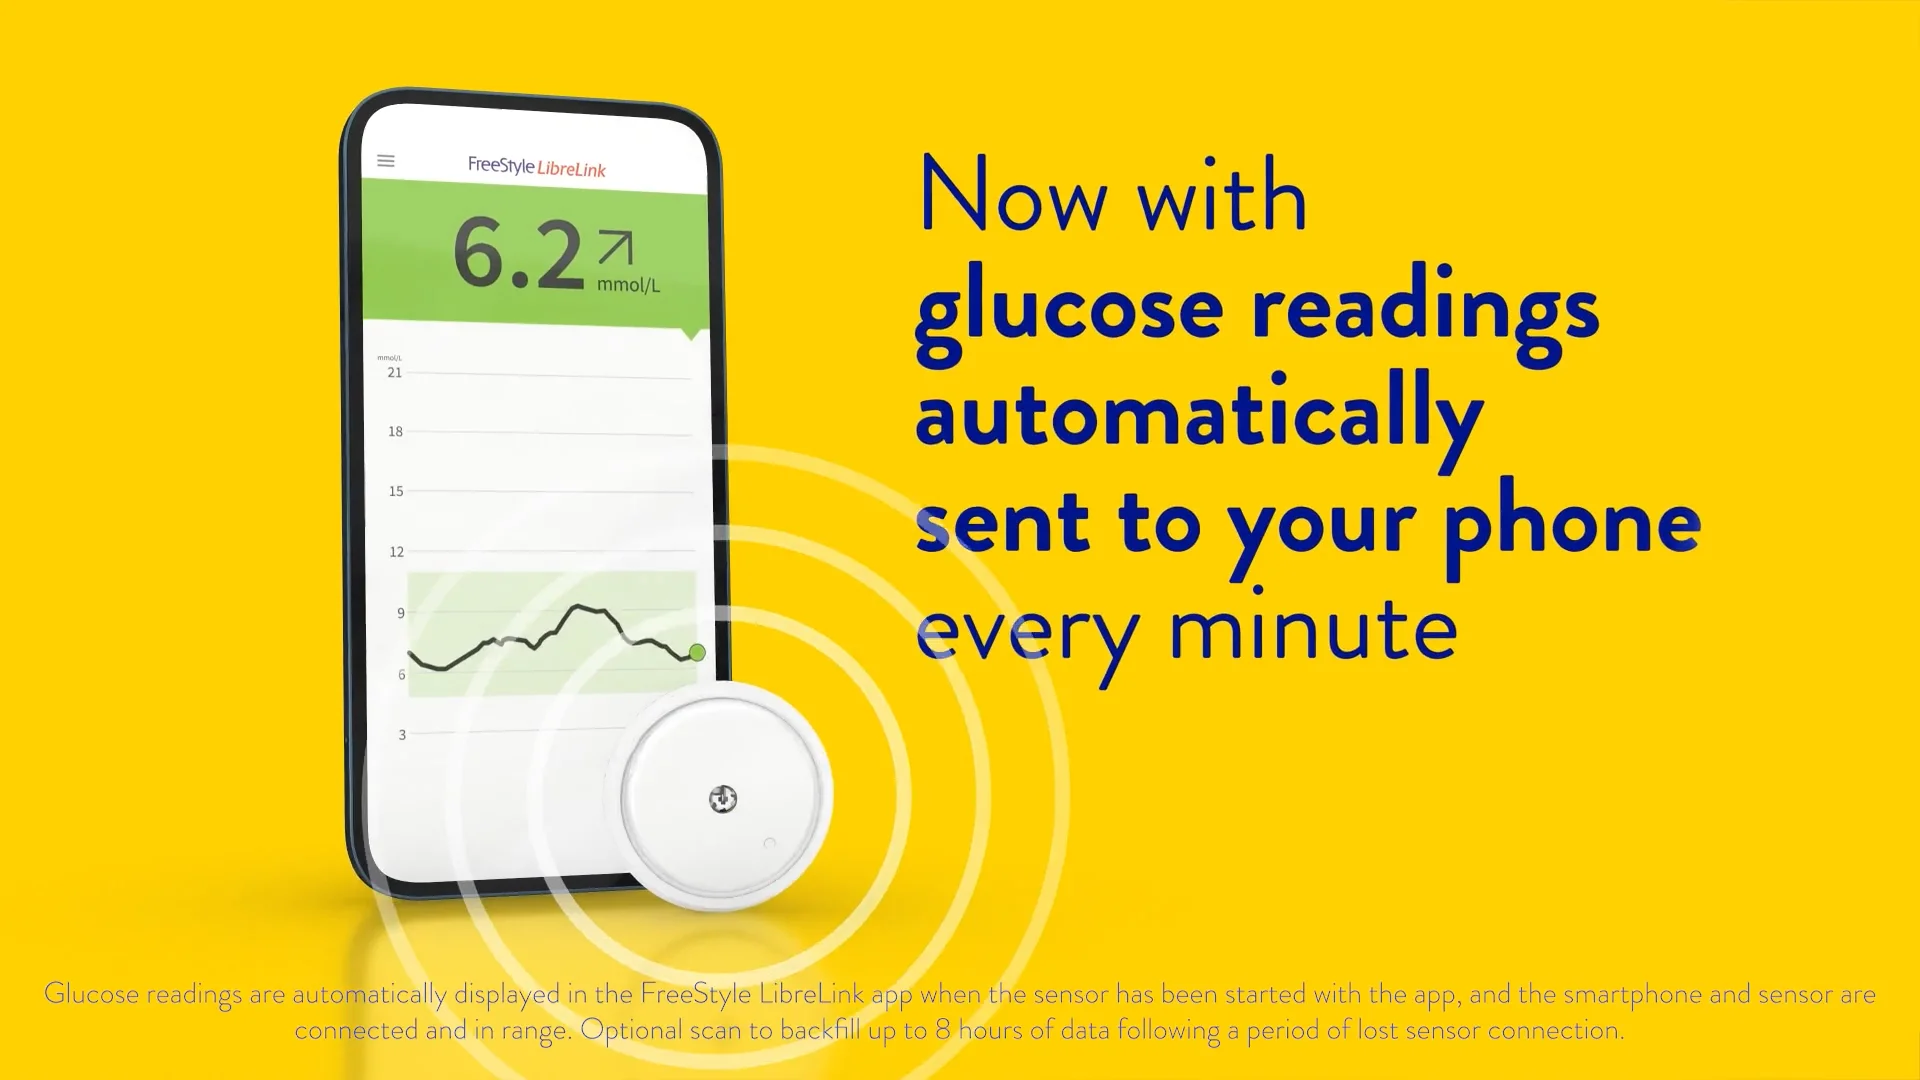
Meanwhile, Abbott are clear that it’s “More data” as it comes minute by minute.
But are these both really “Better”?
How do they help those of us with type 1 and are they beneficial in day to day use of a broader swathe of technology?
This short series will look at the characteristics of the data that is captured from some of these devices and attempt to apply various metrics to evaluate it.
It will also look at how these sensors might be used in the #WeAreNotWaiting world and try and establish if there is guidance we can establish from this.
Variance Evaluation Metric
As part of this evaluation, I’ve decided to introduce a Variance Evaluation Metric (VEM) which is based on a traditional network Jitter analysis technique.
It uses a rolling time-based window to evaluate the standard deviation of absolute deltas within that time period. It gives an indication of the noisiness of the data we are looking at. For consistency, across all sensors, a 15 minute window will be used. This will enable four sensor readings, as a minimum, to be included.
In periods of rapidly rising or falling glucose, we’d expect this value to be comparatively high, whilst in periods where glucose levels are relatively stable, we’d expect to see much smaller numbers. As a result, VEM is best used when two or more sensors are being compared side by side to try and determine the noisiness of the different sources over the same glucose variation periods.
I will apply VEM to Dexcom’s G6 and G7 data where the evaluations have been run side by side, and Libre2 Plus data, to compare the minute-by-minute data with five minute data.
With this metric, I hope to be able to identify whether what we’re told about the sensors and what many have reported about what they’ve seen is accurate.
In short
Amongst the many things missing from the arsenal of ways of assessing CGM is a well understood metric for variability. Whilst the FDA iCGM standard includes accuracy while rising and falling, it doesn’t really have a metric for “data stability”, so that’s what I’m trying to achieve here.
With it, we’ll try and understand whether the variance that’s been reported in the Dexcom G7 is really all that different from the G6 without retrospective smoothing, and whether having minute by minute data generates more noise than a five minute trace, and thus whether what the marketing is trying to help us infer is really valid.
Keep following this thread to see what the outcomes are.
Leave a Reply